Configuring debugging in the ColdFusion Administrator
ColdFusion can provide important debugging information for every application page requested by a browser. The ColdFusion Administrator lets you specify which debugging information to make available and how to display it. The following sections briefly describe the Administrator settings. For more information, see the online Help for the Debugging pages.
Debugging Settings page
In the Administrator, the following options on the Debugging Settings page determine the information that ColdFusion displays in debugging output:
|
Option |
Description |
|---|---|
|
Enable Robust Exception Information |
Enables the display of the following information when ColdFusion displays the exception error page. (Cleared by default.)
|
|
Enable Debugging |
Enables debugging output. When this option is cleared, no debugging information is displayed, including all output of cftrace and cftimer calls. (Cleared by default.) You should disable debugging output on production servers. Doing so increases security by ensuring that users cannot see debugging information. It also improves server response times. You can also limit debugging output to specific IP addresses; for more information, see Debugging IP addresses page. |
|
Select Debugging Output Format |
Determines how to display debugging output:
|
|
Report Execution Times |
Lists ColdFusion pages that run as the result of an HTTP request and displays execution times, ColdFusion also highlights in red pages with processing times greater than the specified value, and you can select between a summary display or a more detailed, tree structured, display. |
|
General Debug Information |
Displays general information about the request: ColdFusion Version, Template, Time Stamp, User Locale, User Agent, User IP, and Host Name. |
|
Database Activity |
Displays debugging information about access to SQL data sources and stored procedures. (Selected by default.) |
|
Exception information |
Lists all ColdFusion exceptions raised in processing the request. (Selected by default.) |
|
Tracing information |
Displays an entry for each cftrace tag. When this option is cleared, the debugging output does not include tracing information, but the output page does include information for cftrace tags that specify inline="Yes". (Selected by default.) For more information on using the cftrace tag, seeUsing the cftrace tag to trace execution. |
|
Variables |
Enables the display of ColdFusion variable values. When this option is cleared, disables display of all ColdFusion variables in the debugging output. (Selected by default.) When enabled, ColdFusion displays the values of variables in the selected scopes. You can select to display the contents of any of the ColdFusion scopes except Variables, Attributes, Caller, and ThisTag. To enhance security, Application, Server, and Request variable display is disabled by default, |
|
Enable Performance Monitoring |
Allows the standard NT Performance Monitor application to display information about a running ColdFusion application server. |
|
Enable CFSTAT |
Enables you to use of the cfstat command line utility to monitor real-time performance. This utility displays the same information that ColdFusion writes to the NT System Monitor, without using the System Monitor application. For information on the cfstat utility, see Configuring and Administering ColdFusion. |
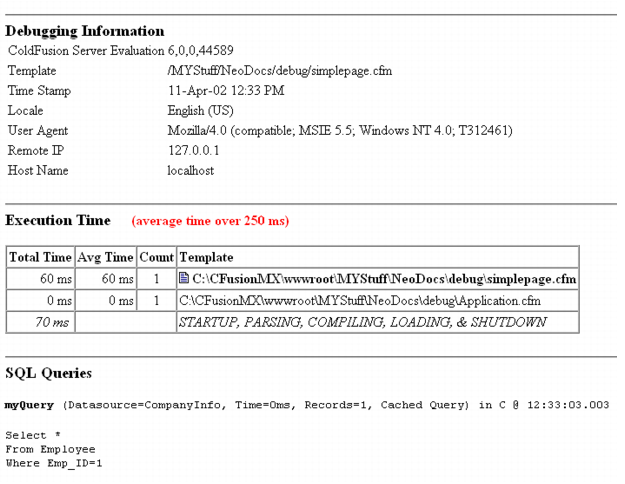
The following image shows a sample debugging output using the classic output format:

Debugging IP addresses page
By default, when you enable debugging output, the output is visible only to local users (that is, via IP address 127.0.0.1). You can specify additional IP addresses whose users can see debugging output, or even disable output to local users. In the Administrator, use the Debugging IPs page to specify the addresses that can receive debugging messages.

