Execution Time
The Execution Time section displays the time required to process the request. It displays information about the time required to process all pages required for the request, including the Application.cfc, Application.cfm, and OnRequestEnd.cfm pages, if used, and any CFML custom tags, pages included by the cfinclude tag, and any ColdFusion component (CFC) pages.
 To display execution time for a specific block of code, use the cftimer tag.
You can display the execution time in two formats:
- Summary
- Tree
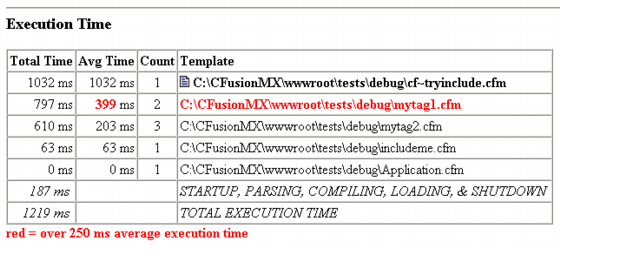
The summary format displays one entry for each ColdFusion page processed during the request. If a page is processed multiple times it appears only once in the summary. For example, if a custom tag gets called three time in a request, it appears only once in the output. In the classic.cfm output format, the summary format looks like the following image:

The following table describes the display fields:
|
Column |
Description |
|---|---|
|
Total Time |
The total time required to process all instances of the page and all pages that it uses. For example, if a request causes a page to be processed two times, and the page includes another page, the total time includes the time required to process both pages twice. |
|
Avg Time |
The average time for processing each instance of this page and the pages that it uses. The Avg Time multiplied by the Count equals the Total Time. |
|
Count |
The number of times the page is processed for the request. |
|
Template |
The path name of the page. |
The page icon indicates the requested page.
Any page with an average processing time that exceeds the highlight value that you set on the Debugging Settings page in the ColdFusion Administrator appears in red.
The next to last line of the output displays the time that ColdFusion took to parse, compile, and load pages, and to start and end page processing. This image is not included in the individual page execution times. The last line shows the sum of all the time it took to process the request.
The tree execution time format is a hierarchical, detailed view of how ColdFusion processes each page. If a page includes or calls second page, the second page appears below and indented relative to the page that uses it. Each page appears once for each time it is used. Therefore, if a page gets called three times in processing a request, it appears three times in the tree. Therefore the tree view displays both processing times and an indication of the order of page processing.
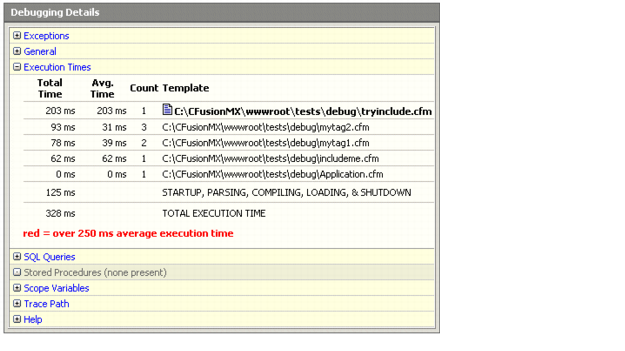
The tree format looks as follows in the dockable.cfm output format:

As in the summary view, the execution times (in parentheses) show the times to process the listed page and all pages required to process the page, that is, all pages indented below the page in the tree.
By looking at this output in this image you can determine the following information:
- ColdFusion took 0 ms to process an Application.cfm page as part of the request.
- The requested page was tryinclude.cfm. It took 203 ms to process this page and all pages required to execute it. The code directly on this page took 71 milliseconds (203 - 93 - 16 - 23) to process.
- The mytag2.cfm page was processed three times. All processing took 93 milliseconds, and the average processing time was 31 milliseconds. (This page does not call any other pages.)
- The mytag1.cfm page was processed two times. All processing took 78 milliseconds, and the average processing time was 39 milliseconds. This time included the time to process mytag2.cfm (this tag calls the mytag2 custom tag); therefore, the code directly on the page took an average of 8 milliseconds and a total of 16 milliseconds to process.
- The includeme.cfm page took about 62 ms to process. This processing time includes the time to process the mytag1.cfm, and therefore also the time to process mytag2.cfm once. Therefore the code directly on the page took 23 milliseconds (62-39) to process.
- ColdFusion took 125 ms for processing that was not associated with a specific page.
- The total processing time was 328 milliseconds, the sum of 125 + 203.

