Using the dockable.cfm output format
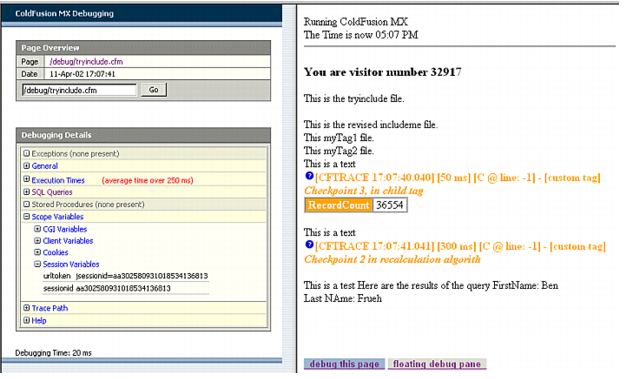
The dockable.cfm output format has several features that are not included in the classic.cfm debugging display, as the following image of a docked debug pane shows:

ColdFusion displays two buttons at the bottom of each page, as described in the following table:
|
Button |
Description |
|---|---|
|
Debug This page |
Tells ColdFusion to display the debugging information for the selected frame. Refreshes the debug pane if you select it for the current frame (or the application does not use frames). |
|
Floating/Docked debug pane |
Toggles the display between a floating window and a pane docked to the left of the selected frame. |
The debug pane has the following features:
- You can expand and collapse each debugging information category, such as Exceptions, by clicking on the plus or minus sign (+ or -) in front of each category heading. You can also expand and collapse each scope data type display in the Scoped Variables section.
- The top of the debug pane displays the URL of the application page being debugged (as identified by the cgi.script_name variable). Click this link to refresh the page and display the debugging information that results. (You can also refresh the page and debugging information by using your browser's Refresh button or key.)
- The debug pane also displays a box where you can enter a page pathname or URL. When you click the Go button, ColdFusion processes the page and the debug pane is updated with the debugging information for the new page.

